Know your tools.
The DevTools is you primary set of tools as a Web Developer.
And the wisest choice you can make is to know them very, very well.
In this lesson I’ll start from the basics and guide you to know most of the things you’ll need.
I also made a video:
The Browser DevTools
I don’t think there was a time where websites and web applications were easy to build, as for backend technologies, but client-side development was surely easier than now, generally speaking.
Once you figured out the differences between Internet Explored and Netscape Navigator, and avoided the proprietary tags and technology, all you had to use was HTML and later CSS.
JavaScript was a tech for creating dialog boxes and a little bit more, but was definitely not as pervasive as today.
Although lots of web pages are still plain HTML + CSS, like this page, many other websites are real applications that run in the browser.
Just providing the source of the page, like browser did once upon a time, was not enough.
Browser had to provide much more information on how they rendered the page, and what the page is currently doing, hence they introduced a feature for developers: their developer tools.
Every browser is different and so their dev tools are slightly different. At the time of writing my favorite developer tools are provided by Chrome, and this is the browser we’ll talk here, although also Firefox and Edge have great tools as well.
Overview of the DevTools
How to open them
HTML Structure and CSS
The most basic form of usage, and a very common one, is inspecting the content of a webpage. When you open the DevTools that’s the panel the Elements panel is what you see:
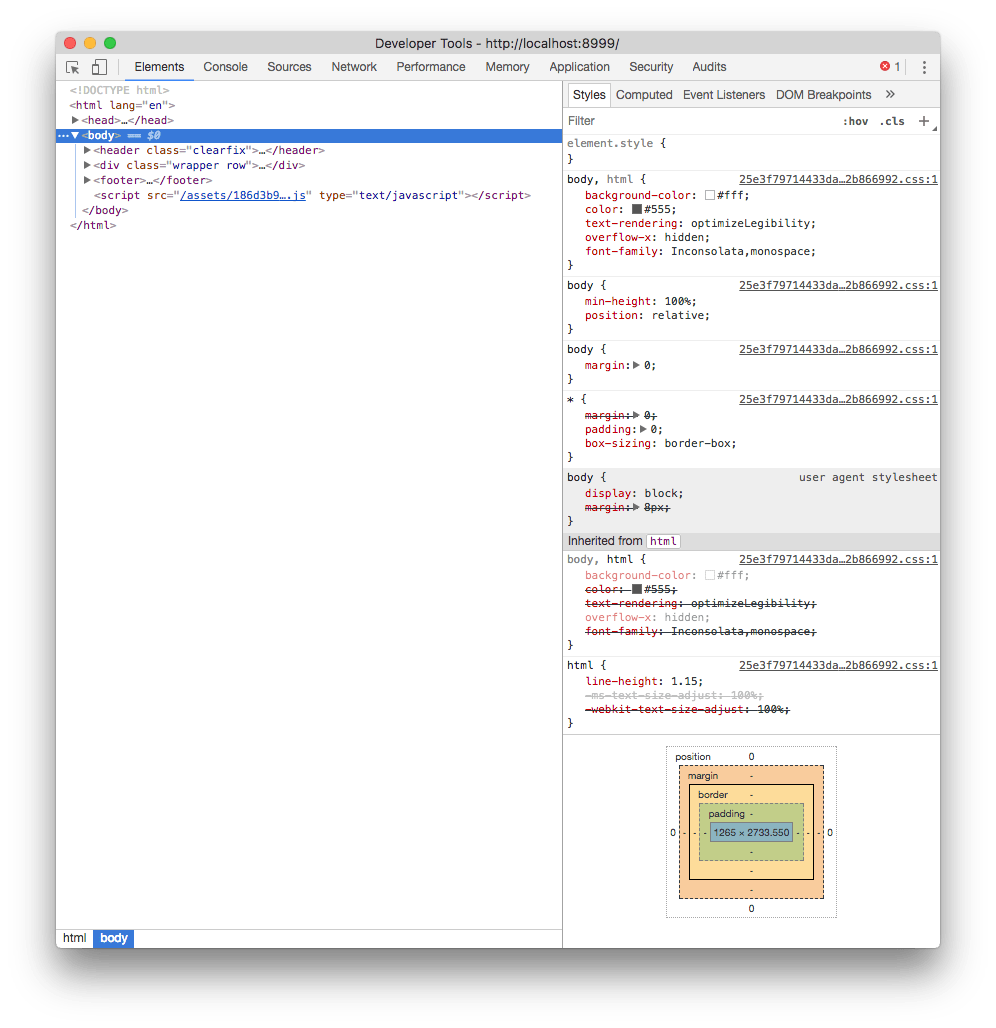
The HTML panel
On the left, the HTML that composes the page.
Hovering the elements in the HTML panel highlights the element in the page, and clicking the first icon in the toolbar allows you to click an element in the page, and analyze it in the inspector.
You can drag and drop elements in the inspector to live change their positioning in the page.
The CSS styles panel
On the right, the CSS styles that are applied to the currently selected element.
In addition to editing and disabling properties, you can add a new CSS property, with any target you want, by clicking the + icon.
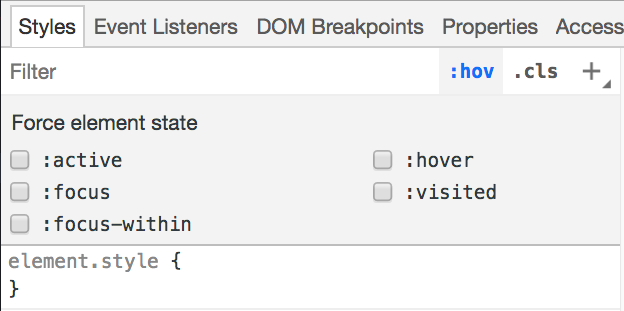
Also you can trigger a state for the selected element, so you can see the styles applied when it’s active, hovered, on focus.
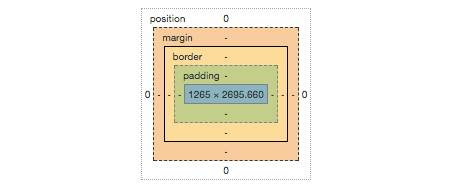
At the bottom, the box model of the selected element helps you figure out margins, paddings, border and dimensions at a quick glance:
The Console
The second most important element of the DevTools is the Console.
The Console can be seen on its own panel, or by pressing Esc in the Elements panel, it will show up in the bottom.
The Console serves mainly two purposes: executing custom JavaScript and error reporting.
Executing custom JavaScript
At the bottom of the Console there is a blinking cursor. You can type any JavaScript there, and it will be promptly executed. As an example, try running:
alert('test')
The special identifier $0 allows you to reference the element currently selected in the elements inspector. If you want to reference that as a jQuery selector, use $($0).
You can write more than one line with shift-enter. Pressing enter at the end of the script runs it.
Error reporting
Any error, warning or information that happens while rendering the page, and subsequently executing the JavaScript, is listed here.
For example failing to load a resource from the network, with information on why, is reported in the console.
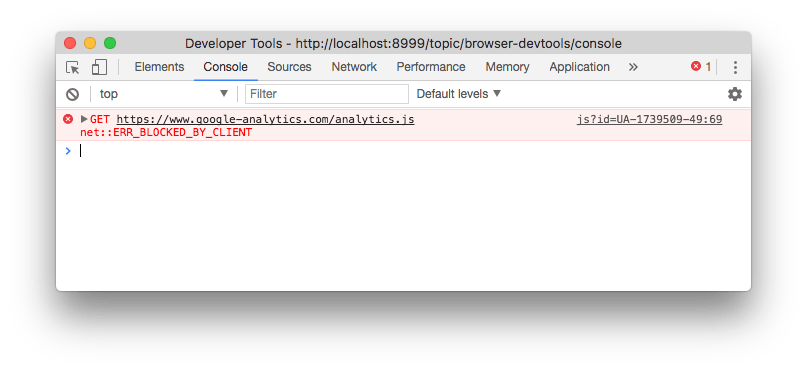
In this case, clicking the resource URL brings you to the Network panel, showing more info which you can use to determine the cause of the problem.
You can filter those messages by level (Error / Warning / Info) and also filter them by content.
Those messages can be user-generated in your own JavaScript by using the Console API:
console.log('Some info message')
console.warn('Some warning message')
console.error('Some error message')
More on the Console API later on
The emulator
The Chrome DevTools embed a very useful device emulator which you can use to visualize your page in every device size you want.
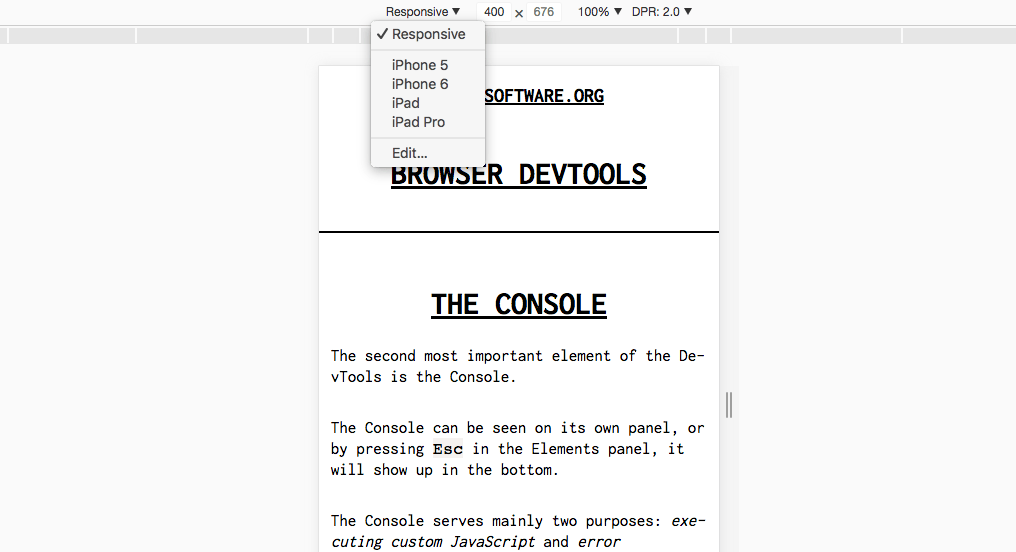
You can choose from the presets the most popular mobile devices, including iPhones, iPads, Android devices and much more, or specify the pixel dimensions yourself, and the screen definition (1x, 2x retina, 3x retina HD).
In the same panel you can setup network throttling for that specific Chrome tab, to emulate a low speed connection and see how the page loads, and the “show media queries” option shows you how media queries modify the CSS of the page.
The network panel
The Network Panel of the DevTools allows you to see all the connections that the browser must process while rendering a page.
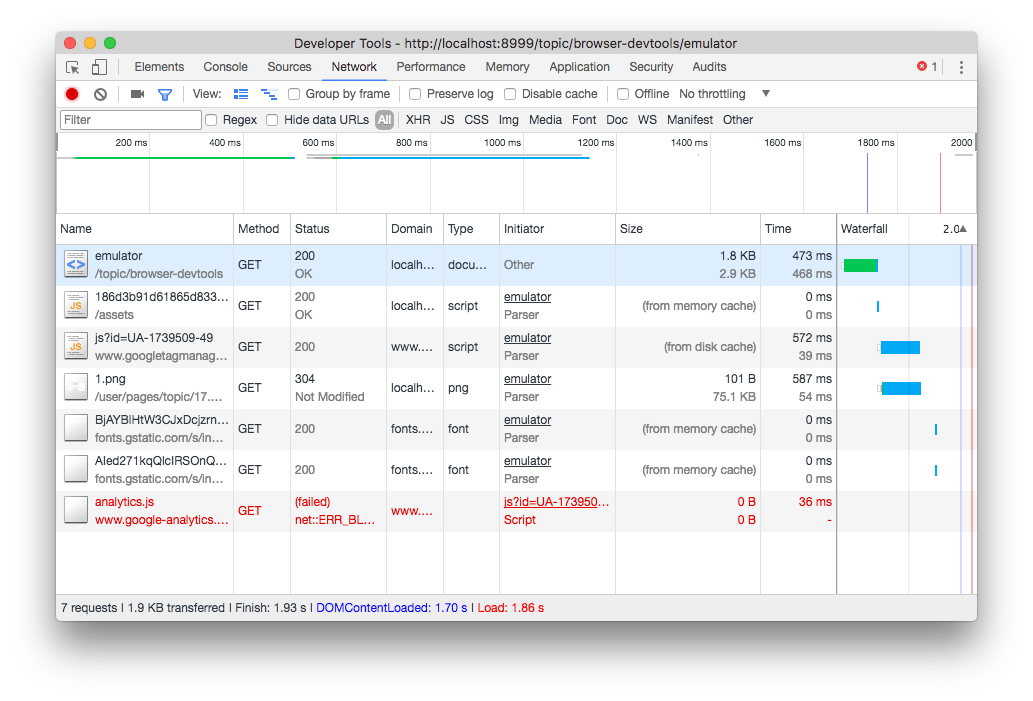
At a quick glance the page shows:
- a toolbar where you can setup some options and filters
- a loading graph of the page as a whole
- every single request, with HTTP method, response code, size and other details
- a footer with the summary of the total requests, the total size of the page and some timing indications.
A very useful option in the toolbar is preserve log. By enabling it, you can move to another page, and the logs will not be cleared.
Another very useful tool to track loading time is disable cache. This can be enabled globally in the DevTools settings as well, to always disable cache when DevTools is open.
Clicking a specific request in the list shows up the detail panel, with HTTP Headers report:
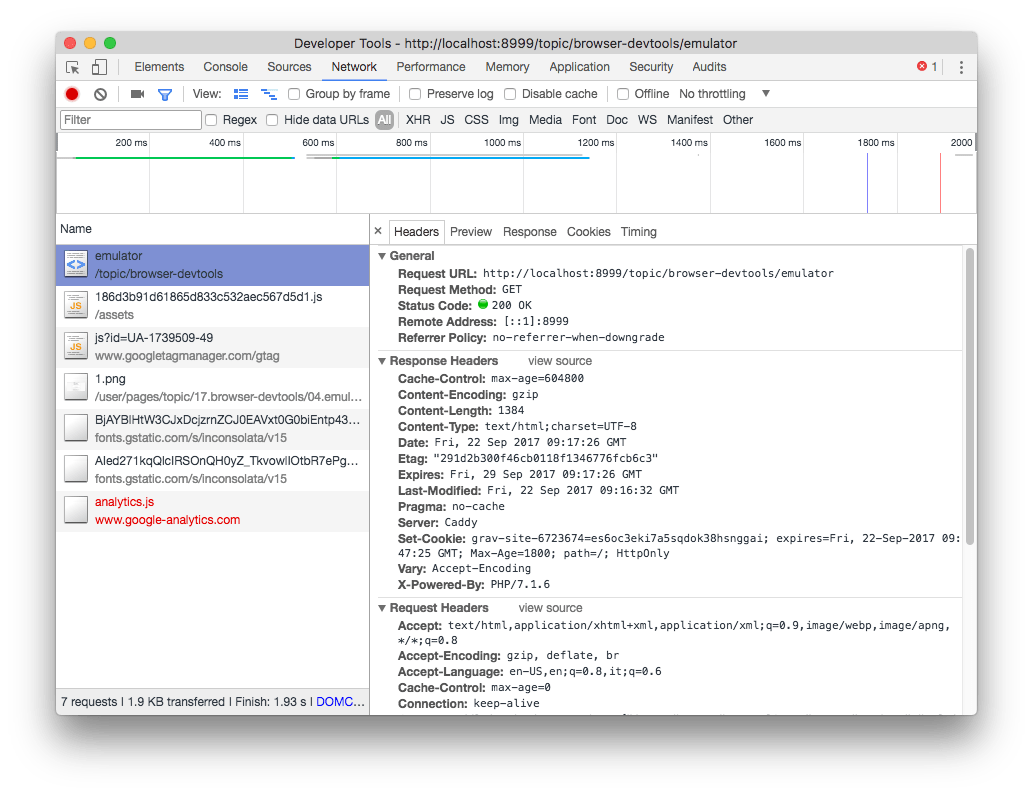
And the loading time breakdown:
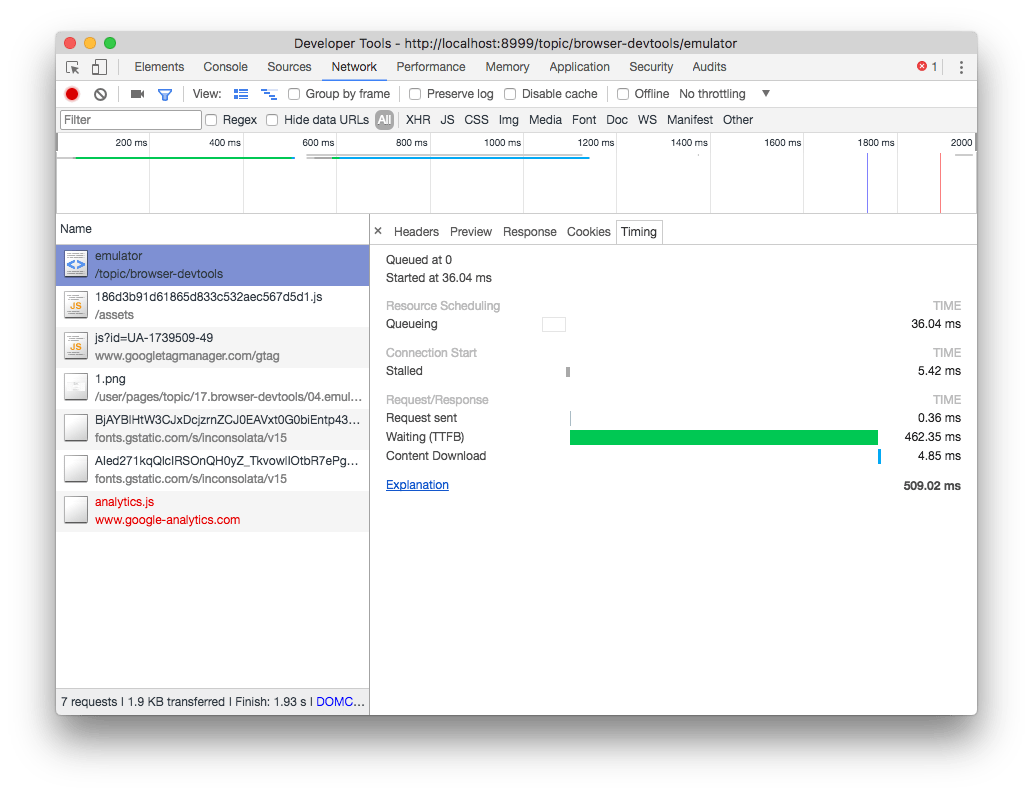
JavaScript debugger
If you click an error message in the DevTools Console, the Sources tab opens and in addition to pointing you to the file and line where the error happened, you have the option to use the JavaScript debugger.
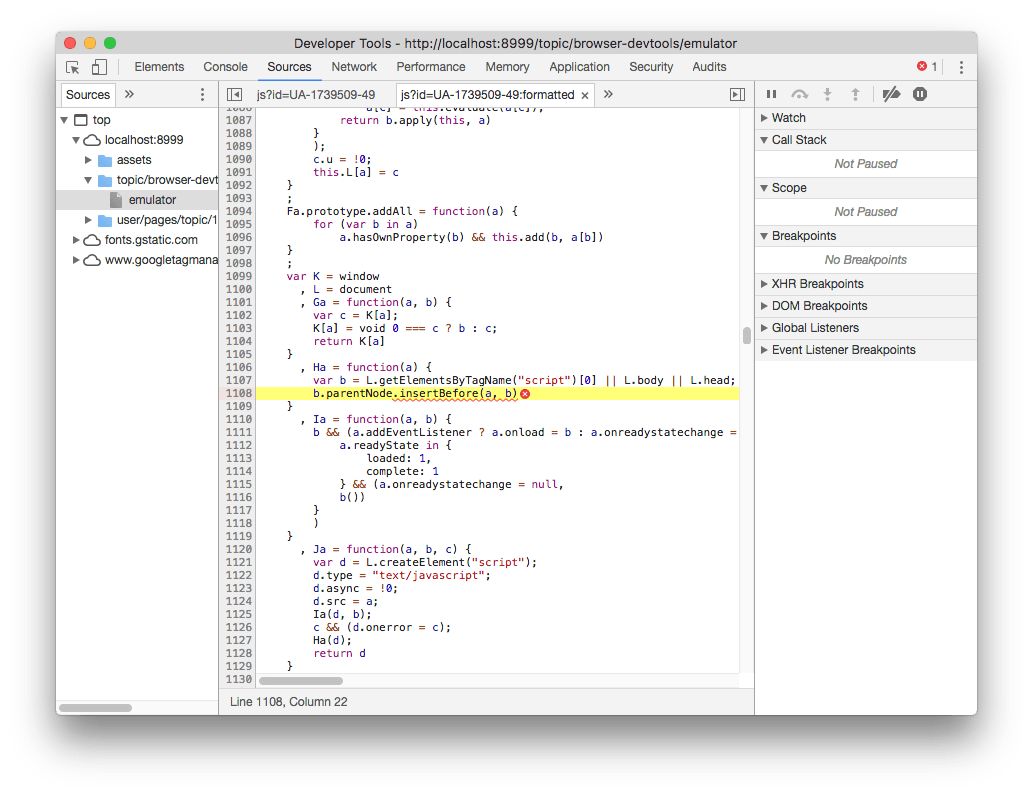
This is a full-featured debugger. You can set breakpoints, watch variables, and listen to DOM changes or break on specific XHR (AJAX) network requests, or event listeners.
Application and Storage
The Application tab gives you lots of information about which information is stored inside the browser relative to your website.
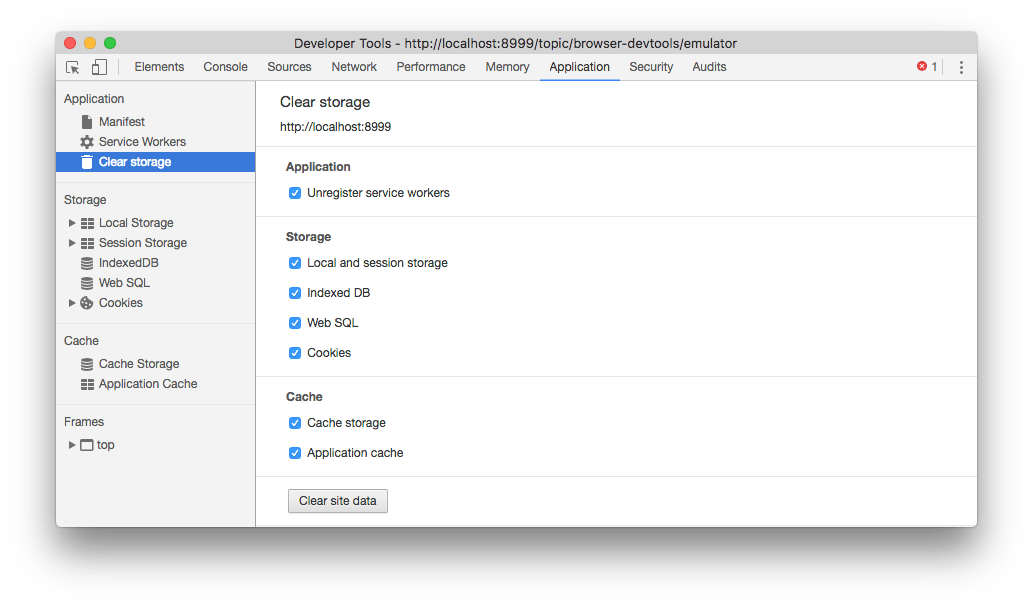
Storage
You gain access to detailed reports and tools to interact with the application storage:
- Local Storage and Session Storage (The Web Storage API)
- IndexedDb
- Cookies
We’ll talk about them in the full course
and you can quickly wipe any information, to start with a clean slate.
Application
This tab also gives you tools to inspect and debug Progressive Web Apps.
Click manifest to get information about the web app manifest, used to allow mobile users to add the app to their home, and simulate the “add to homescreen” events.
Service workers let you inspect your application service workers. If you don’t know what service workers are, in short they are a fundamental technology that powers modern web apps, to provide features like notification, capability to run offline and synchronize across devices.
Security tab
The Security tab gives you all the information that the browser has relatively to the security of the connection to the website.
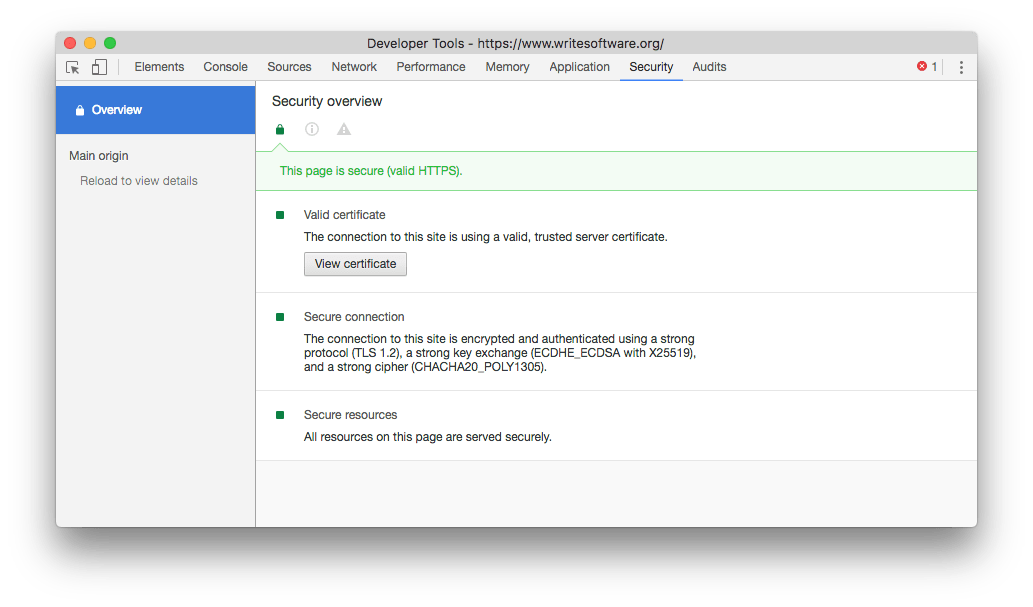
If there is any problem with the HTTPS connection, if the site is served over TLS, it will provide you more information about what’s causing it.
Audits
The Audits tab will help you find and solve some issues relative to performance and in general the quality of the experience that users have when accessing your website.
You can perform various kinds of audits depending on the kind of website:
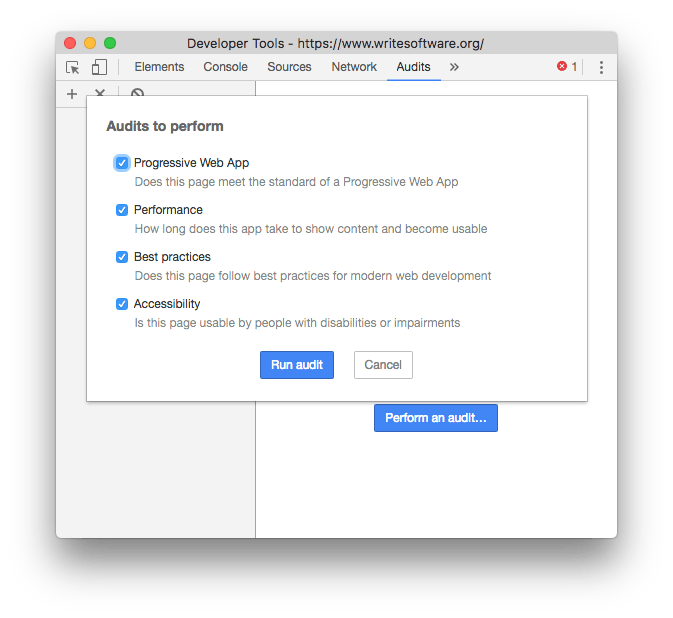
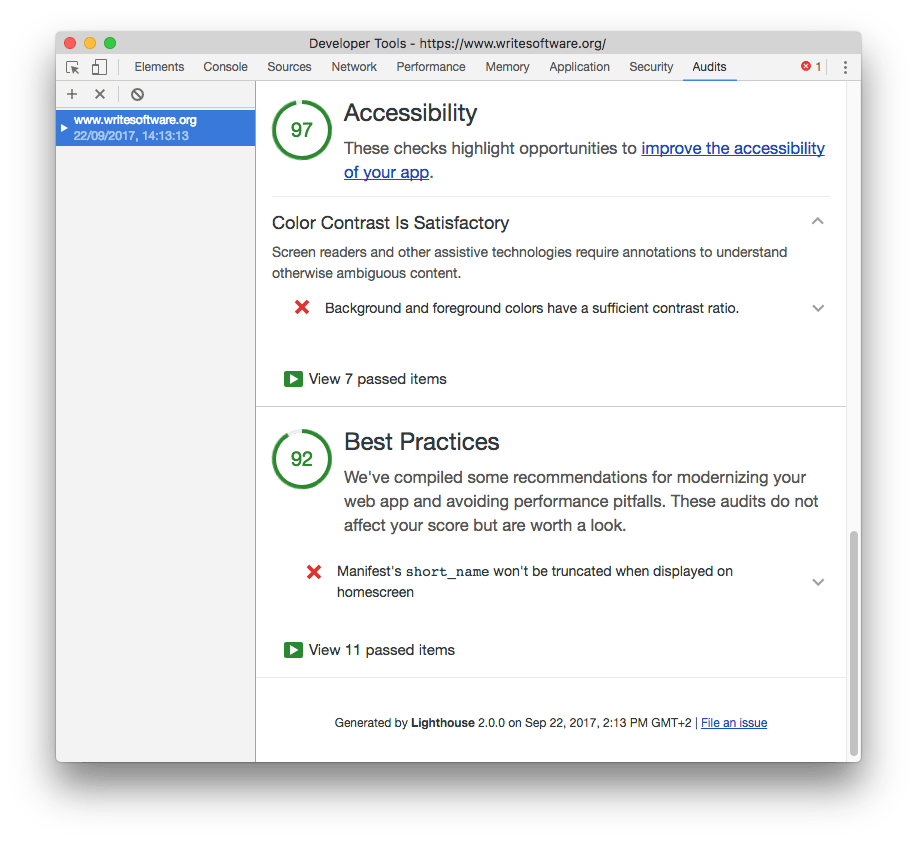
The audit is provided by Lighthouse, an open source automated website quality check tool. It takes a while to run, then it provides you a very nice report with key actions to check.
Tips and actionable how-tos
title: A list of cool Chrome DevTools Tips and Tricks
Drag and Drop in the Elements panel
In the Elements panel you can drag and drop any HTML element and change its position across the page
Reference the currently selected element in the Console
Select a node in the Elements panel, and type $0 in the console to reference it.
Tip: if you’re using jQuery, you can enter
$($0)to access the jQuery API on this element.
Use the value of the last operation in the Console
Use $_ to reference the return value of the previous operation executed in the Console
Add CSS and edit the element state
In the Elements panel there are 2 super useful buttons.
The first lets you add a new CSS property, with any selector you want but pre-filling the currently selected element:
The second one lets you trigger a state for the selected element, so you can see the styles applied when it’s active, hovered, on focus.
Find where a CSS property is defined
cmd-click (ctrl-click on Windows) a CSS property in the Elements panel, the DevTools will point you to the place where that is defined, in the Source panel
Save to file the modified CSS
Click the name of the CSS file that you edited. The inspector opens it into the Sources pane and from there you can save it with the live edits you applied.
This trick does not work for new selectors added using +, or into the element.style properties, but only for modified, existing ones.
Screenshot a single element
Select an element and press cmd-shift-p (or ctrl-shift-p in Windows) to open the Command Menu, and select Capture node screenshot
Find an element using CSS selectors
Pressing cmd-f (ctrl-f in Windows) opens the search box in the Elements panel.
You can type any string in there to match the source code, or you can also use CSS selectors to have Chrome generate an image for you:
Shift-enter in the Console
To write commands that span over multiple lines in the Console, press shift-enter.
Once you’re ready, press enter at the end of the script to execute it:
Clear the Console
You can clear the console using the Clear button on the top-left of the console, or by pressing ctrl-l or cmd-k.
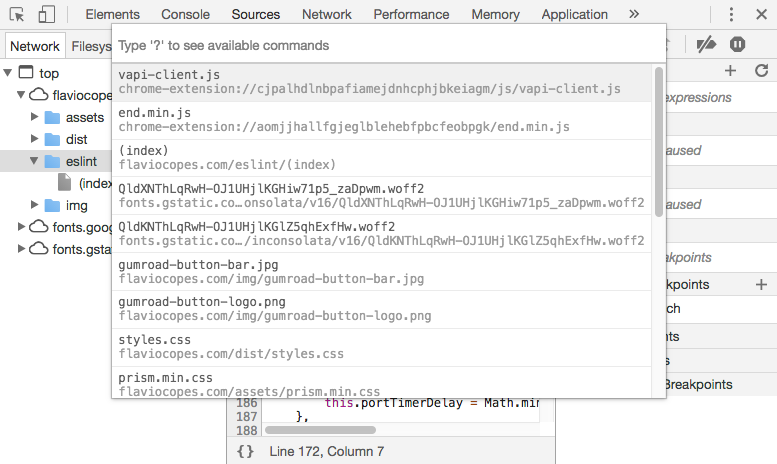
Go to…
In the Sources panel:
cmd-o(ctrl-oin Windows), shows all the files loaded by your page.cmd-shift-o(ctrl-shift-oin Windows) shows the symbols (properties, functions, classes) in the current file.ctrl-ggoes to a specific line.
Watch Expression
Instead of writing again and again a variable name or an expression you are going to check a lot during a debug session, add it to the Watch Expression list.
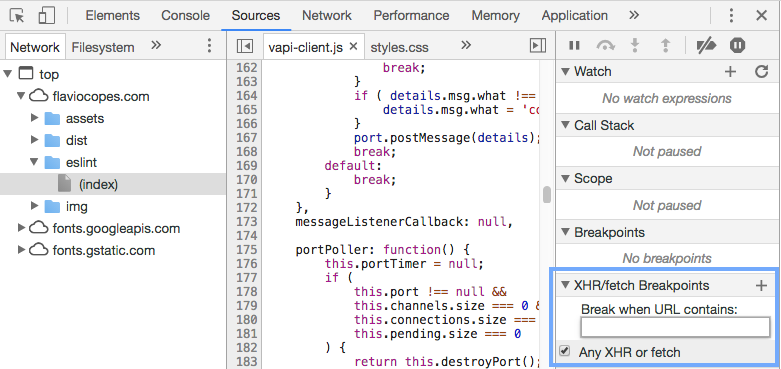
XHR/Fetch debugging
From the debugger open the XHR/Fetch Breakpoints panel.
You can set it to break any time an XHR or Fetch call is sent, or just on specific ones:
We’ll talk about them in the full course
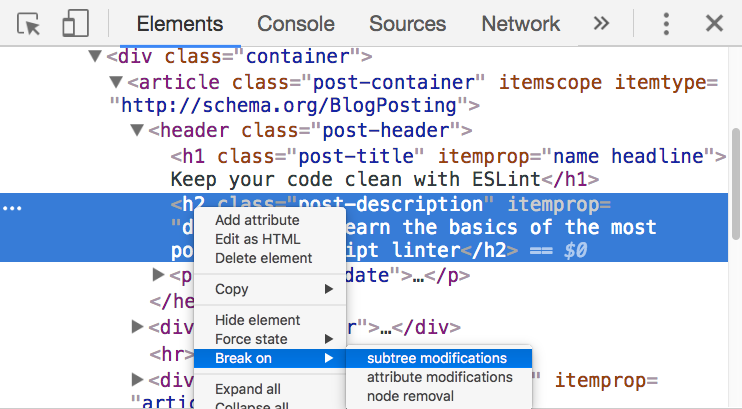
Debug on DOM modifications
Right-click an element and enable Break on Subtree Modifications: whenever a script traverses that element children and modifies them, the debugger stops automatically to let you inspect what’s happening.
The Console API
Every browser exposes a console that lets you interact with the Web Platform APIs and also gives you an inside look at the code by printing messages that are generated by your JavaScript code running in the page.
Overview of the console
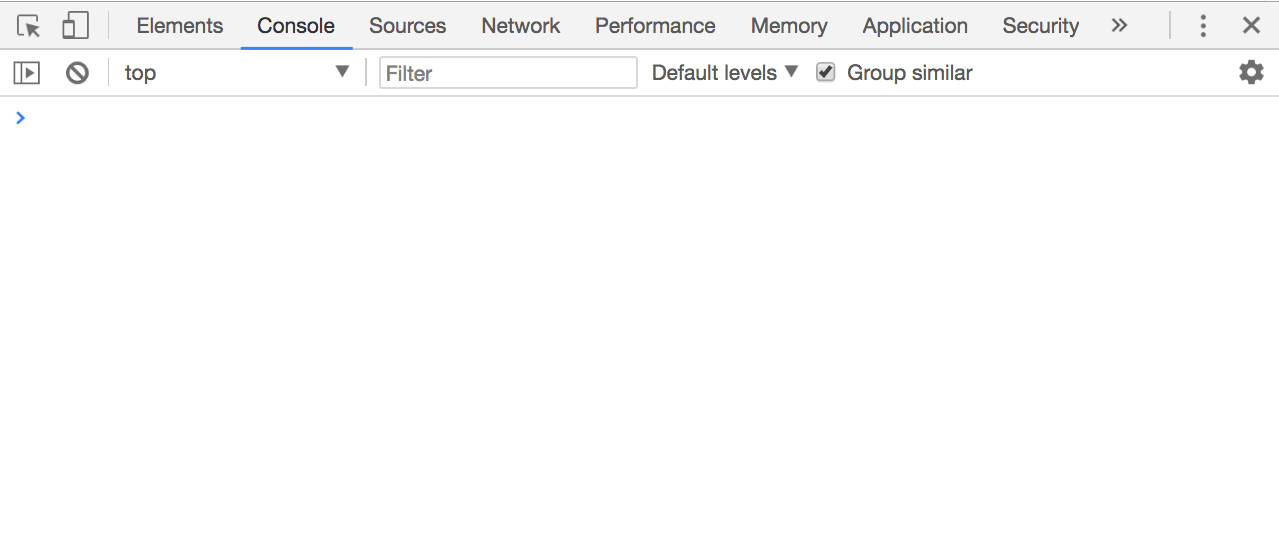
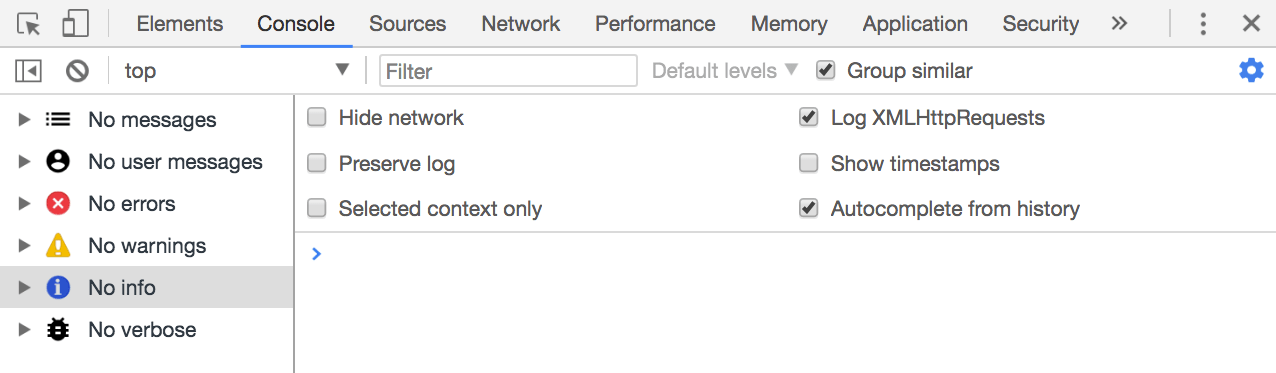
The console toolbar is simple. There’s a button to clear the console messages, something you can also do by clicking cmd-K in macOS, or ctrl-K on Windows, a second button that activates a filtering sidebar, that lets you filter by text, or by type of message, for example error, warning, info, log, or debug messages.
You can also choose to hide network-generated messages, and just focus on the JavaScript log messages.
The console is not just a place where you can see messages, but also the best way to interact with JavaScript code, and many times the DOM. Or, just get information from the page.
Let’s type our first message. Notice the >, let’s click there and type
console.log('test')
The console acts as a REPL, which means read–eval–print loop. In short, it interprets our JavaScript code and prints something.
Use console.log formatting
As you see, console.log('test') prints ‘test’ in the Console.
Using console.log in your JavaScript code can help you debug for example by printing static strings, but you can also pass it a variable, which can be a JavaScript native type (for example an integer) or an object.
You can pass multiple variables to console.log, for example:
console.log('test1', 'test2')
We can also format pretty phrases by passing variables and a format specifier.
For example:
console.log('My %s has %d years', 'cat', 2)
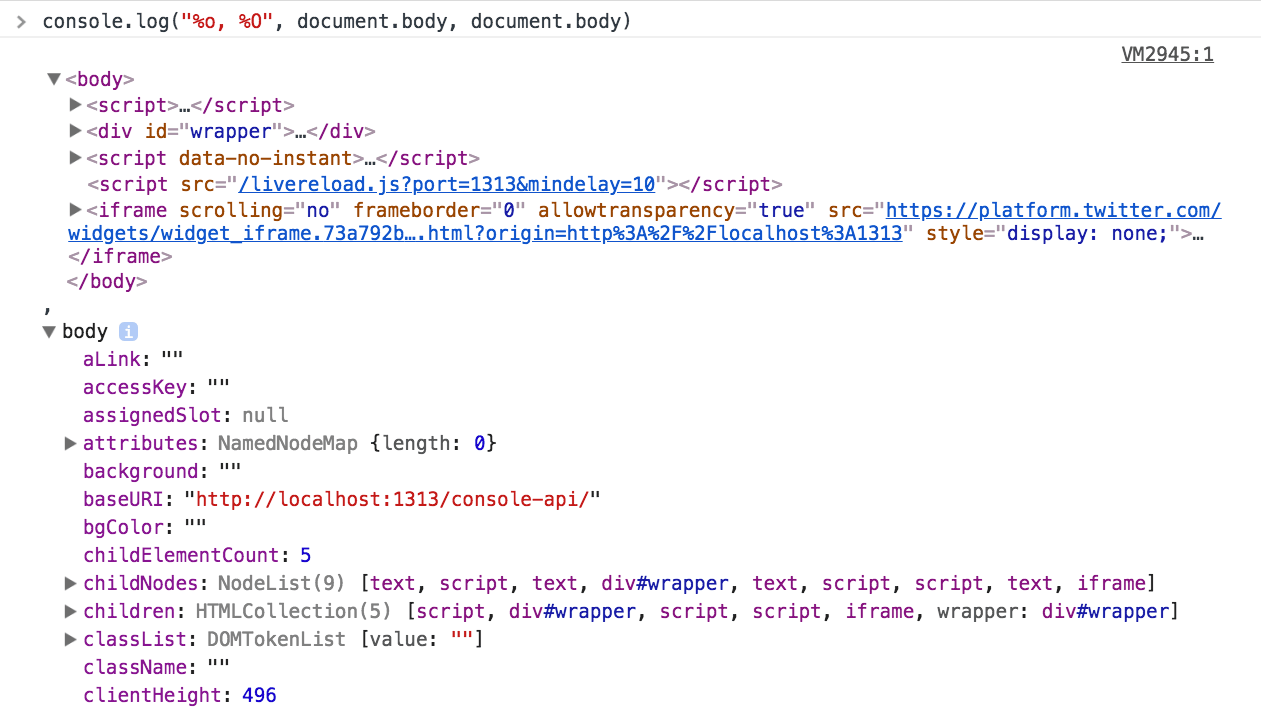
%sformat a variable as a string%dor%iformat a variable as an integer%fformat a variable as a floating point number%ocan be used to print a DOM Element%Oused to print an object representation
Example:
console.log('%o, %O', document.body, document.body)
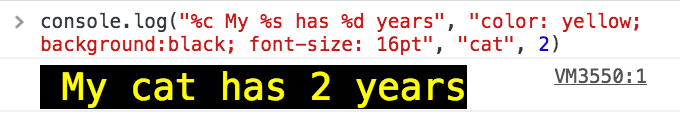
Another useful format specifier is %c, which allows to pass CSS to format a string. For example:
console.log(
  '%c My %s has %d years',
  'color: yellow; background:black; font-size: 16pt',
  'cat',
  2
)
Clear the console
There are three ways to clear the console while working on it, with various input methods.
The first way is to click the Clear Console Log button on the console toolbar.
The second method is to type console.clear() inside the console, or in your a JavaScript function that runs in your app / site.
You can also just type clear().
The third way is through a keyboard shortcut, and it’s cmd-k (mac) or ctrl + l (Win)
Counting elements
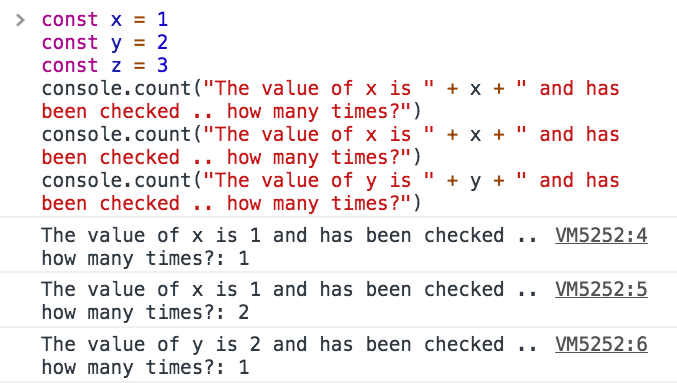
console.count() is a handy method.
Take this code:
const x = 1
const y = 2
const z = 3
console.count(
  'The value of x is ' + x + ' and has been checked .. how many times?'
)
console.count(
  'The value of x is ' + x + ' and has been checked .. how many times?'
)
console.count(
  'The value of y is ' + y + ' and has been checked .. how many times?'
)
What happens is that count will count the number of times a string is printed, and print the count next to it:
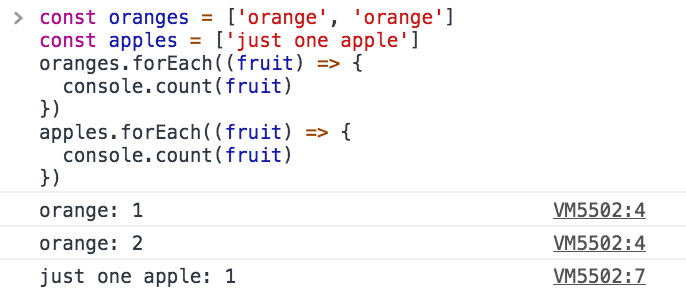
You can just count apples and oranges:
const oranges = ['orange', 'orange']
const apples = ['just one apple']
oranges.forEach((fruit) => {
  console.count(fruit)
})
apples.forEach((fruit) => {
  console.count(fruit)
})
Log more complex objects
console.log is pretty amazing to inspect variables. You can pass it an object too, and it will do its best to print it to you in a readable way. Most of the times this means it prints a string representation of the object.
For example try
console.log([1, 2])
Another option to print objects is to use console.dir:
console.dir([1, 2])
As you can see this method prints the variable in a JSON-like representation, so you can inspect all its properties.
The same thing that console.dir outputs is achievable by doing
console.log('%O', [1, 2])
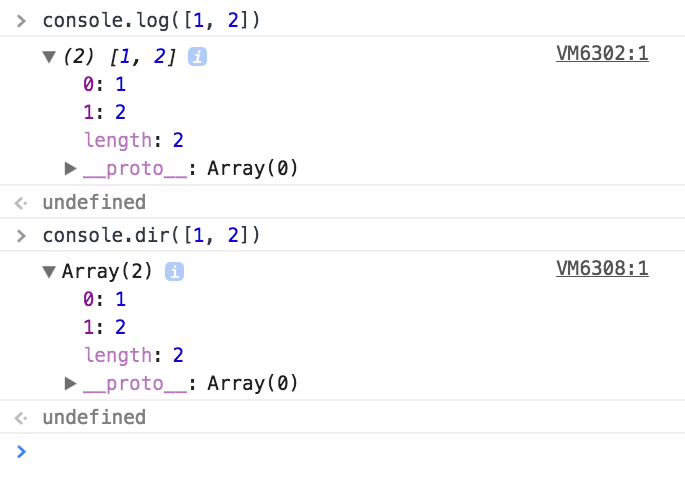
Which one to use depends on what you need to debug of course, and one of the two can do the best job for you.
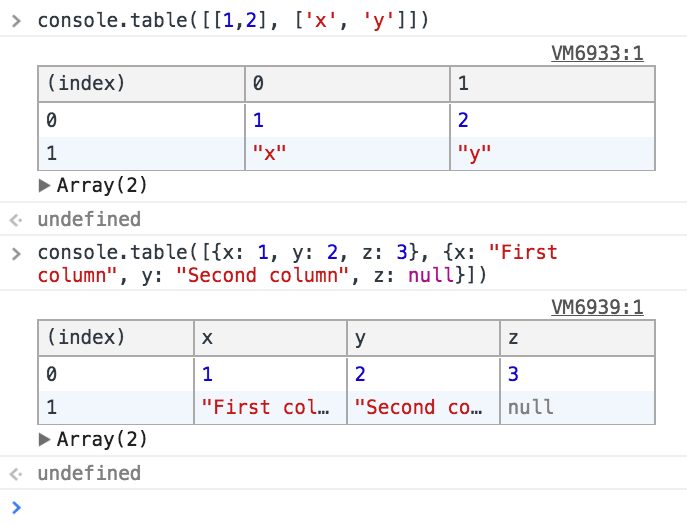
Another function is console.table() which prints a nice table.
We just need to pass it an array of elements, and it will print each array item in a new row.
For example
console.table([
  [1, 2],
  ['x', 'y'],
])
or you can also set column names, by passing instead of an array, an Object Literal, so it will use the object property as the column name
console.table([
  { x: 1, y: 2, z: 3 },
  { x: 'First column', y: 'Second column', z: null },
])
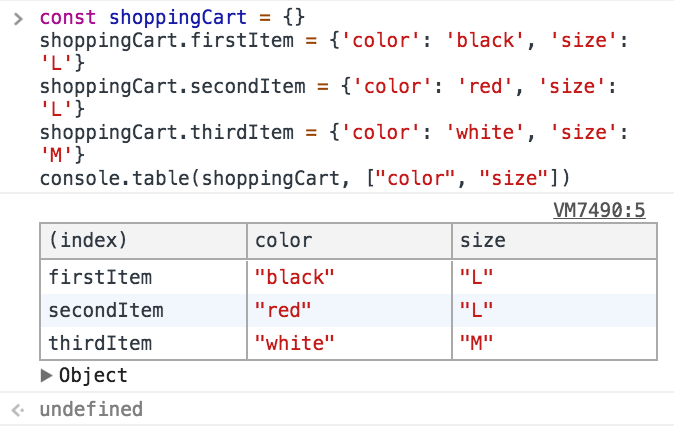
console.table can also be more powerful and if you pass it an object literal that in turn contains an object, and you pass an array with the column names, it will print a table with the row indexes taken from the object literal. For example:
const shoppingCart = {}
shoppingCart.firstItem = { color: 'black', size: 'L' }
shoppingCart.secondItem = { color: 'red', size: 'L' }
shoppingCart.thirdItem = { color: 'white', size: 'M' }
console.table(shoppingCart, ['color', 'size'])
Logging different error levels
As we saw console.log is great for printing messages in the Console.
We’ll now discover three more handy methods that will help us debug, because they implicitly indicate various levels of error.
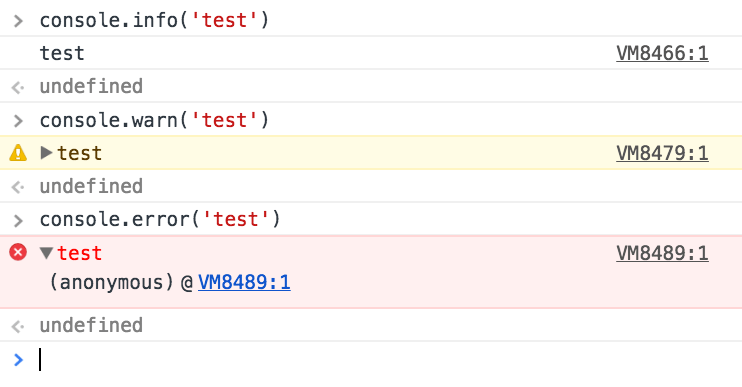
First, console.info()
As you can see a little ‘i’ is printed beside it, making it clear the log message is just an information.
Second, console.warn()
prints a yellow exclamation point.
If you activate the Console filtering toolbar, you can see that the Console allows you to filter messages based on the type, so it’s really convenient to differentiate messages because for example if we now click ‘Warnings’, all the printed messages that are not warnings will be hidden.
The third function is console.error()
this is a bit different than the others because in addition to printing a red X which clearly states there’s an error, we have the full stack trace of the function that generated the error, so we can go and try to fix it.
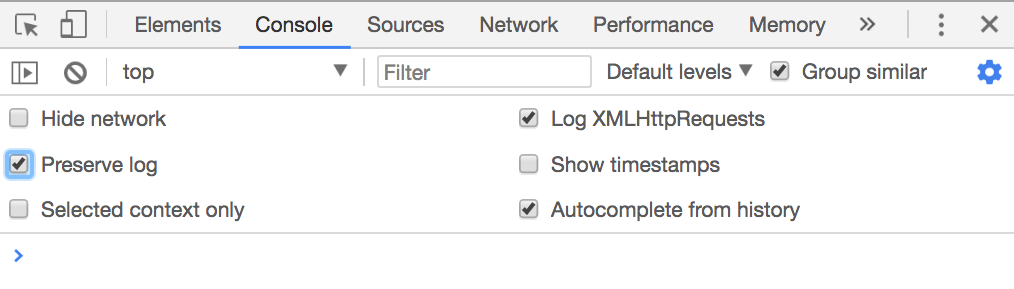
Preserve logs during navigation
Console messages are cleared on every page navigation, unless you check the Preserve log in the console settings:
Grouping console messages
The Console messages can grow in size and the noise when you’re trying to debug an error can be overwhelming.
To limit this problem the Console API offers a handy feature: Grouping the Console messages.
Let’s do an example first.
console.group('Testing the location')
console.log('Location hash', location.hash)
console.log('Location hostname', location.hostname)
console.log('Location protocol', location.protocol)
console.groupEnd()
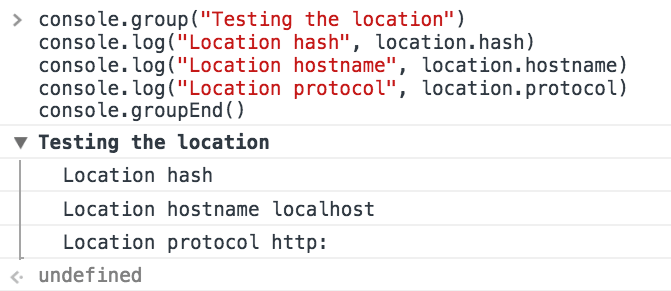
As you can see the Console creates a group, and there we have the Log messages.
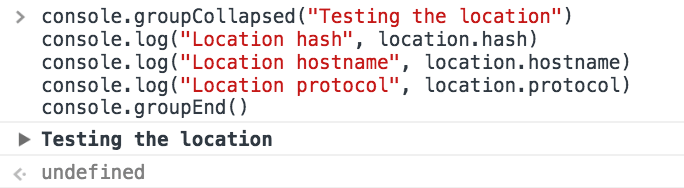
You can do the same, but output a collapsed message that you can open on demand, to further limit the noise:
console.groupCollapsed('Testing the location')
console.log('Location hash', location.hash)
console.log('Location hostname', location.hostname)
console.log('Location protocol', location.protocol)
console.groupEnd()
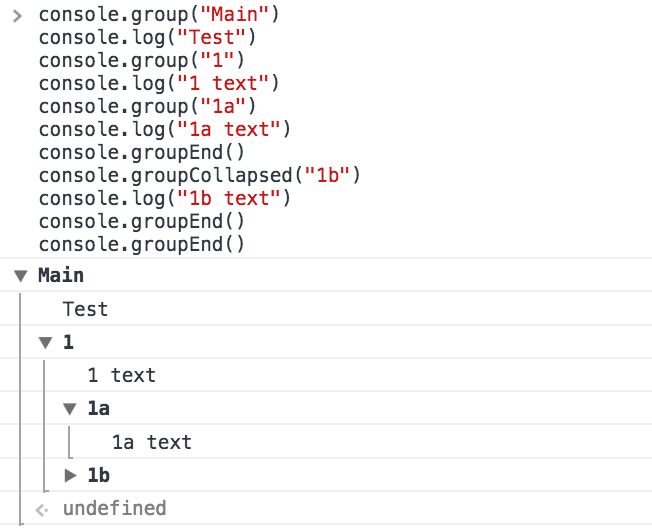
The nice thing is that those groups can be nested, so you can end up doing
console.group('Main')
console.log('Test')
console.group('1')
console.log('1 text')
console.group('1a')
console.log('1a text')
console.groupEnd()
console.groupCollapsed('1b')
console.log('1b text')
console.groupEnd()
console.groupEnd()
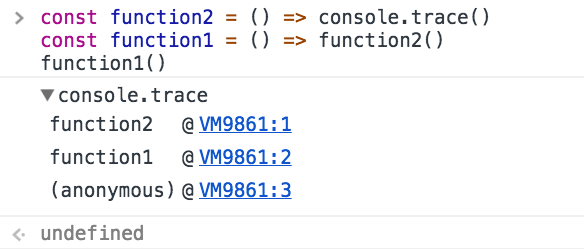
Print the stack trace
There might be cases where it’s useful to print the call stack trace of a function, maybe to answer the question how did you reach that part of code?
You can do so using console.trace():
const function2 = () => console.trace()
const function1 = () => function2()
function1()
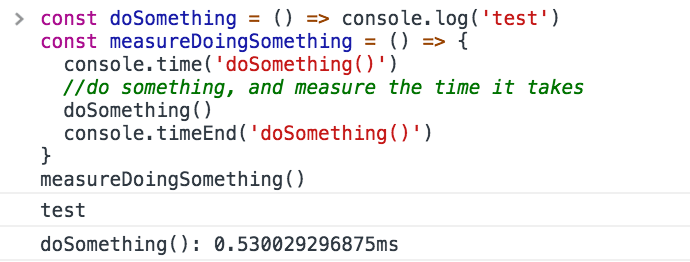
Calculate the time spent
You can easily calculate how much time a function takes to run, using time() and timeEnd()
const doSomething = () => console.log('test')
const measureDoingSomething = () => {
  console.time('doSomething()')
  //do something, and measure the time it takes
  doSomething()
  console.timeEnd('doSomething()')
}
measureDoingSomething()
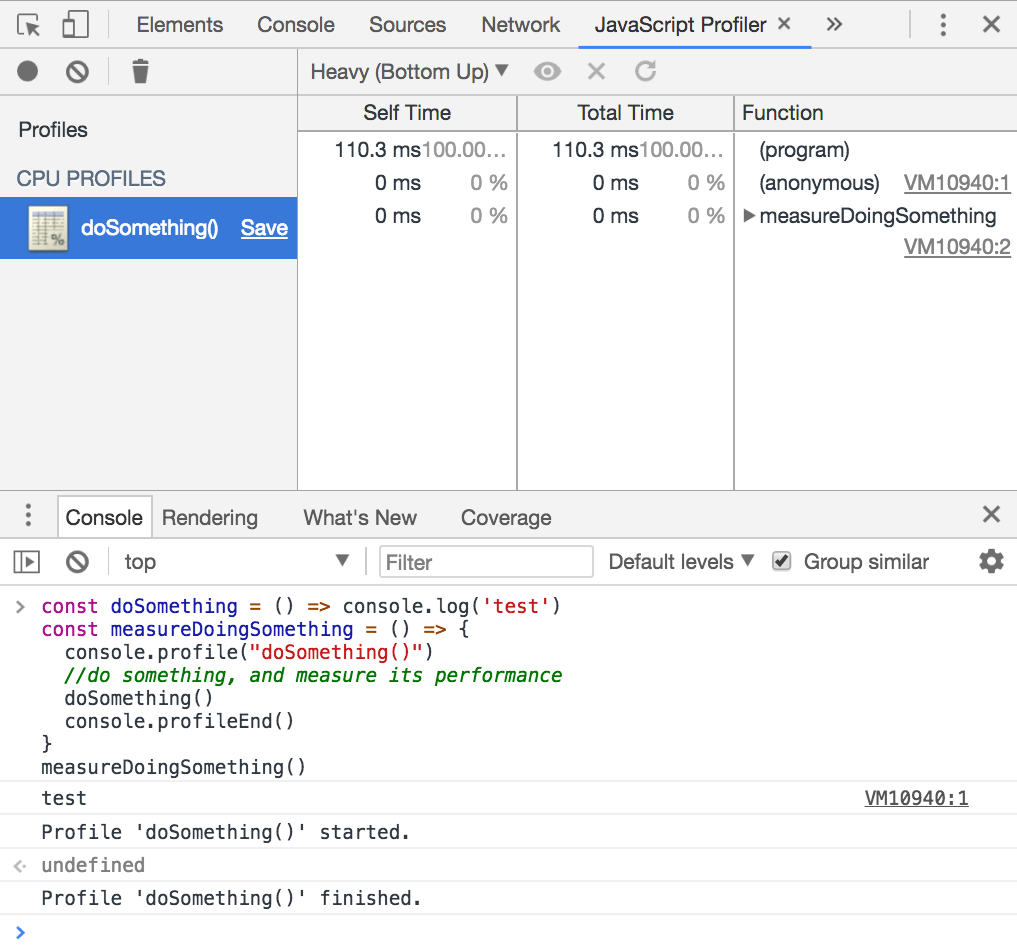
Generate a CPU profile
The DevTools allow you to analyze the CPU profile performance of any function.
You can start that manually, but the most accurate way to do so is to wrap what you want to monitor between the profile() and profileEnd() commands. They are similar to time() and timeEnd(), except they don’t just measure time, but create a more detailed report.
const doSomething = () => console.log('test')
const measureDoingSomething = () => {
  console.profile('doSomething()')
  //do something, and measure its performance
  doSomething()
  console.profileEnd()
}
measureDoingSomething()